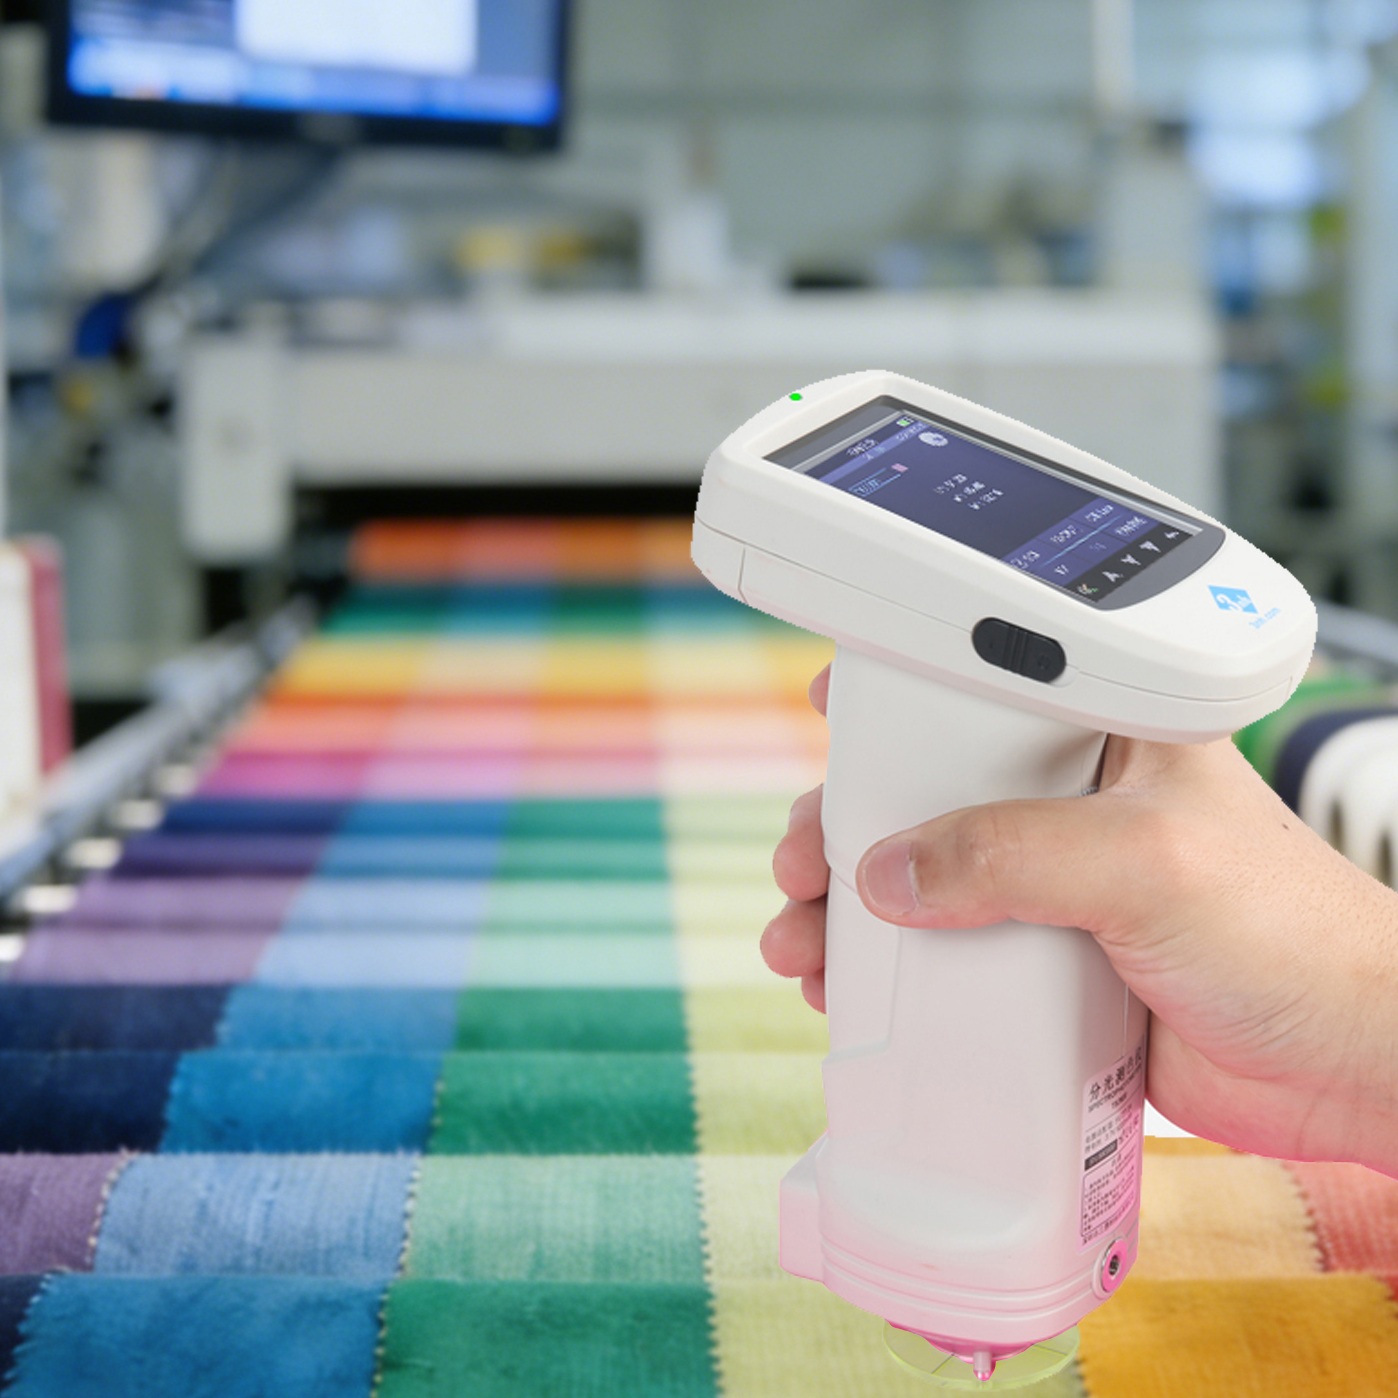
When measuring color, the colorimeter needs to take points on the sample. The range of the points is determined by the measurement aperture of the colorimeter. In addition, after the colorimeter takes points for color measurement, it will give the chromaticity value of the measured area. So, what is the range of the colorimeter's points? How to save the measurement data? The following is an introduction.
Colorimeter measurement aperture
Colorimeter Point Range:
The colorimeter's point range refers to the area of points that the colorimeter selects on the sample to be measured when measuring color. This range is usually determined by the colorimeter's measurement spot size.
When using a colorimeter for color measurement, it is important to ensure that the spot size is appropriate to adequately represent the overall color characteristics of the sample. Here are some common considerations for the spot range of a colorimeter:
1. Spot diameter
The spot diameter of a colorimeter refers to the diameter of the circular area formed by the light beam on the sample surface. The choice of spot diameter usually depends on the size and surface characteristics of the sample being measured. For small samples, a smaller spot diameter can be selected, while for large samples, a larger spot diameter may be required.
2. Measure distance
The distance at which the colorimeter is measuring will also affect the size of the light spot. Different instruments may produce the same or different sized light spots at different measuring distances. When choosing the measuring distance, the size and surface condition of the sample need to be considered.
3. Sample surface
Some samples may have non-uniform surfaces, such as textures, patterns, or reflective surfaces. In this case, you need to ensure that the light spot is large enough to cover the entire sample surface and account for these surface characteristics in the measurement results.
4. Measurement Purpose
Different measurement purposes may require different spot sizes. For example, if the purpose is to detect the overall color consistency of the entire product, a larger spot may be required. If the purpose is to detect color differences in a local area, a smaller spot may be required.
In actual use, according to the characteristics of the sample being measured and the measurement requirements, choosing the right spot size is a key factor in ensuring the accuracy of color difference measurement. Usually, colorimeters provide different spot sizes to meet the needs of different applications.
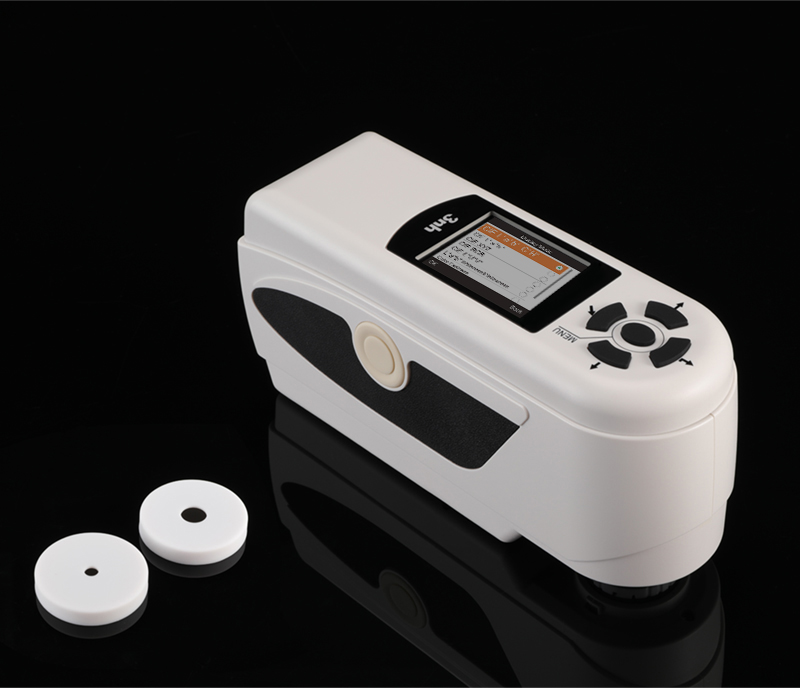
Colorimeter data storage
How to save colorimeter measurement data:
There are two main ways to save the colorimeter measurement data: one is to save it on the instrument, and the other is to save it on the computer. The details are as follows:
1. Save on the colorimeter
Colorimeters usually have built-in memory, which can store the measured data directly inside the colorimeter. The advantage of this method is that the colorimeter can be used for measurement without a computer. At the same time, since the data and the instrument are bound, the accuracy of the data can be guaranteed. In addition, since the data is stored inside the colorimeter and does not need to be transmitted, the privacy of the data can be better protected. Generally speaking, this storage method is only suitable for small amounts of data.
However, this method of storage also has some drawbacks. First, the built-in memory capacity is limited, and if you need to store a large amount of data, you need to export the data frequently. Second, if the device is damaged or lost, the data stored in it will also disappear. At the same time, for data that needs to be used by multiple people in collaboration, everyone needs to export and transfer the data.
2. Save on your computer
Another way is to save the measurement data on a computer. The advantage of this method is that it can store a large amount of data and can easily retrieve, share and back up the data. At the same time, since most colorimeters are equipped with USB interfaces, exporting data only requires simple data transmission.
In addition, another benefit of saving data on a computer is that it allows for more flexible and efficient data processing. After the data is saved on a computer, various computer software, such as Excel, MATLAB and other statistical analysis software, can be used to perform data statistics and analysis to draw richer conclusions.
Compared with the method of storing data on hardware instruments, storing data on computers requires attention to data security issues. For example, it is necessary to ensure the computer's anti-virus and firewall settings to prevent data from being attacked and damaged by malicious programs in the computer.
In summary, whether data is stored on a hardware instrument or on a computer, each has its own advantages and disadvantages. According to actual needs, the appropriate storage method should be selected to ensure the security and integrity of the data. If a small amount of data needs to be stored, a hardware instrument with built-in memory is sufficient to meet the needs. If a large amount of data needs to be processed or the data needs to be shared with others, the data should be stored on a computer. Regardless of the storage method used, attention should be paid to the maintenance and security of the data to avoid data loss and the risk of being attacked.
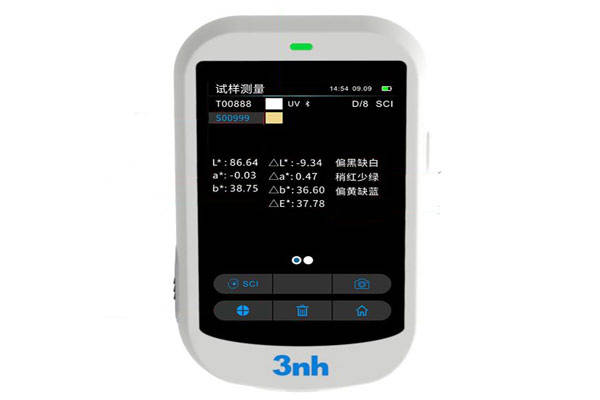
Colorimeter chromaticity value
The meaning of colorimetric values:
The precision colorimeter is an optical detection instrument designed and developed in accordance with CIE standards. It simulates the human eye's sensitivity to red, green, and blue light, and then measures and calculates the three stimulus values X, Y, and Z through photoelectric integration or spectrophotometry, and then converts them into chromaticity parameters such as L, a, and b using relevant formulas. Since the color measurement methods used by different types of colorimeter are not consistent, the accuracy of the color measurement results will also vary. Therefore, it is not very meaningful to simply judge a color with a set of Lab values. However, when we compare two colors, we can use the Lab difference between the two colors to judge the difference between them. Among them:
"L" represents the brightness of the object: 0-100 represents from black to white
"a" represents the red and green color of the object: positive values represent red, negative values represent green
"b" represents the yellow-blue color of the object: positive values represent yellow, negative values represent blue
All colors can be perceived and measured through the Lab color space. These data can also be used to express the color difference between the standard sample and the test sample, and are usually expressed as △Eab (total color difference) △L, △a, △b. The calculation formula is as follows:
△L=L sample-L standard (brightness difference), △L+ means white, △L- means dark
△a=a sample-a standard (red/green difference), △a+ means reddish, △a- means greenish
△b=b sample-b standard (yellow/blue difference), △b+ means yellowish, △b- means bluish
Among them, △L*, △a*, △b* are the differences in lightness L* and chromaticity index a*, b* between the reference sample and the sample being tested. The color difference value is expressed as ΔE*, which is the comprehensive total color difference. The specific calculation method is related to the brightness difference △L, the red-green difference △a, and the yellow-blue difference △b.